SecurePark · Insights Brochure§ 01 — THE LIVE DASHBOARD
▌ 01
The operation, at a glance.
No nightly batch, no spreadsheet reconciliation. Every entry, exit, payment and violation streams into one live operations view that supervisors and finance can read in seconds.
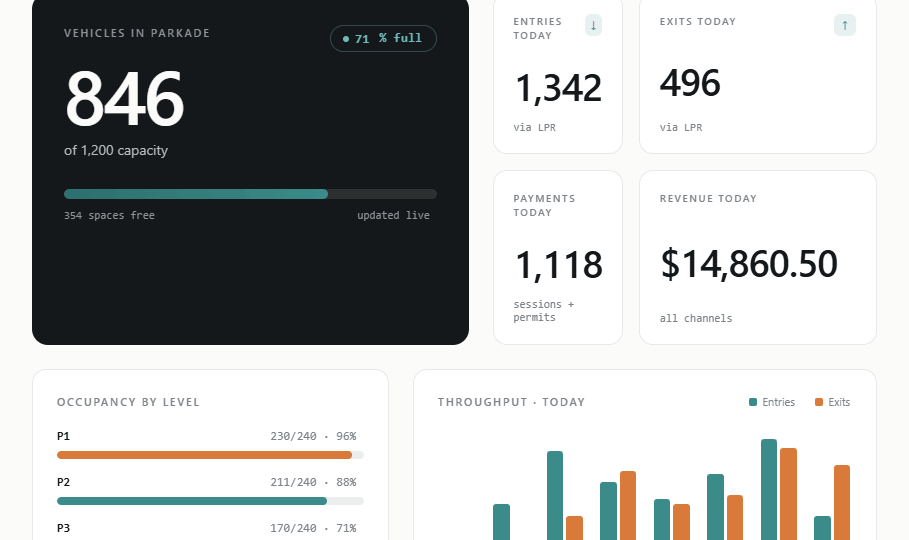
FIG. 01Live occupancy, entries & exits, payments and a streaming event feed.
▌ OCCUPANCYLive capacity
Vehicles in the parkade against capacity, broken down by level — updated as plates read in and out.
▌ THROUGHPUTEntries & exits
LPR-counted entry and exit volumes by hour, so demand peaks are visible as they form.
▌ REVENUEPayments, live
Payment count and revenue across all channels, totalled in real time.
▌ EVENT FEEDEvery event, streamed
Entries, exits, payments and violations as they occur — one continuous operations log.
SecurePark · Insights Brochure§ 02–03 — FROM DATA TO DECISIONS
▌ 02
See it. Act on it.
Real-time visibility means operators respond to conditions as they develop — not the morning after. The same connected data is both a live management tool and a durable record.
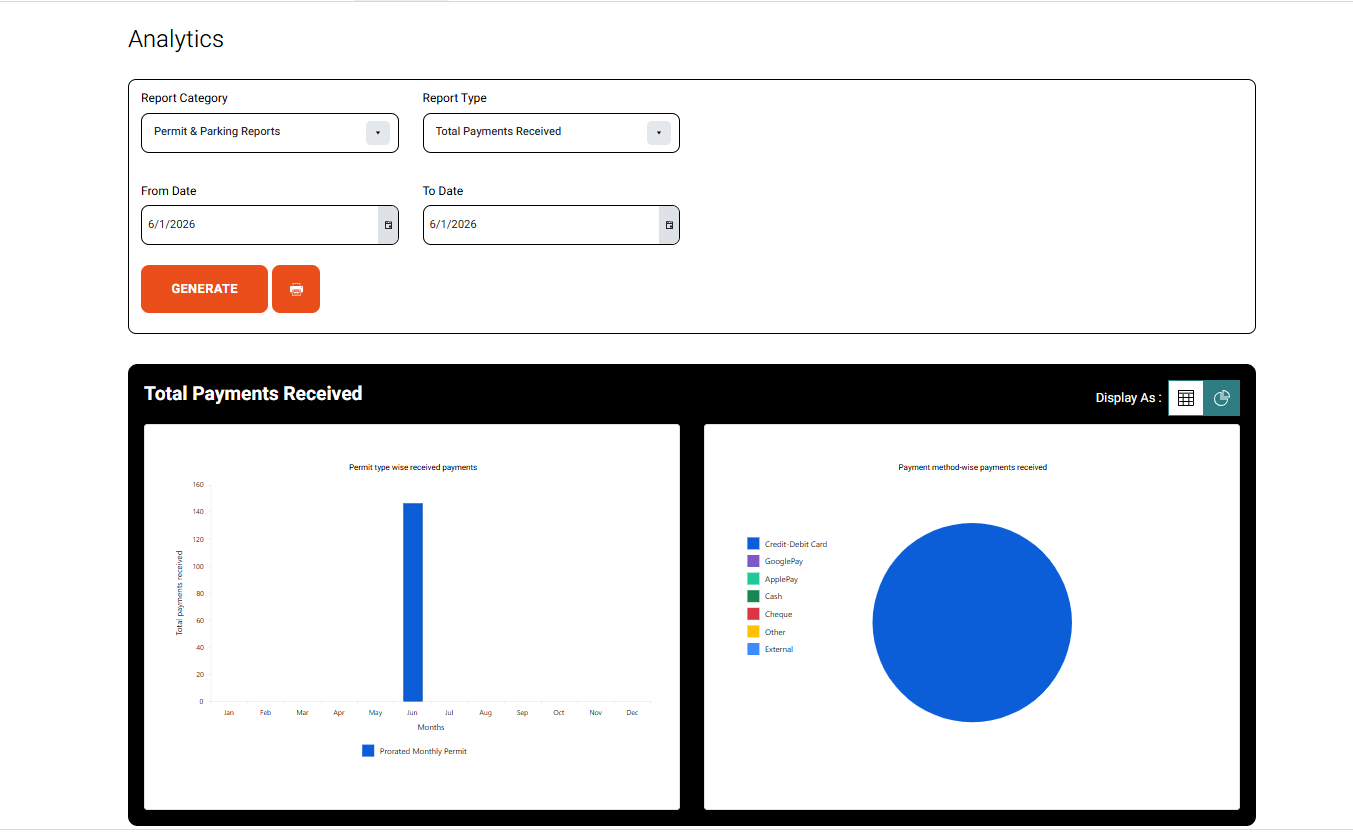
FIG. 02Analytics & reporting
▌ CAPACITYRedirect at the door
See a facility nearing capacity and redirect visitors before it fills.
▌ COVERAGEReallocate patrol
Move enforcement coverage to the lots and hours that need it.
▌ REVENUEConfirm performance
Track revenue against expectation through the day, not at month-end.
▌ 03
One source, two jobs.
The live view and the historical record draw on the same connected data — so what you watch in the moment is the same thing you report on later.
▌ LIVEReal-time management
Monitor occupancy, throughput and revenue as events happen.
▌ DURABLEReliable record
Every event retained for reporting, audit and reconciliation.
▌ PORTFOLIOSite or portfolio
Roll the same view up across one lot or an entire portfolio.
▌ NO BATCHAlways current
No nightly reconciliation — the dashboard is the system of record.
SecurePark · Insights Brochure§ 04 — WHY INSIGHTS
Stop reconciling. Start seeing.
Insights ships with every SecurePark deployment — turning the data your operation already generates into a live view of occupancy, throughput and revenue, on real data, from day one.
live
Occupancy, throughput & revenue
1
Operations view, every team
"This is your lot — not a demo dataset."
▌ WHY · 01
Real-time by default
Every entry, exit and payment reflected the moment it happens.
▌ WHY · 02
One operations view
Occupancy, throughput, revenue and a live feed in a single screen.
▌ WHY · 03
Included, not extra
Ships with every deployment — no add-on, no separate system.